In writing this post recently, Better CI Caching, I wanted to show some graphs of how different stages of the CI cache download/process happened. I’m happy with what I ended up with, example:
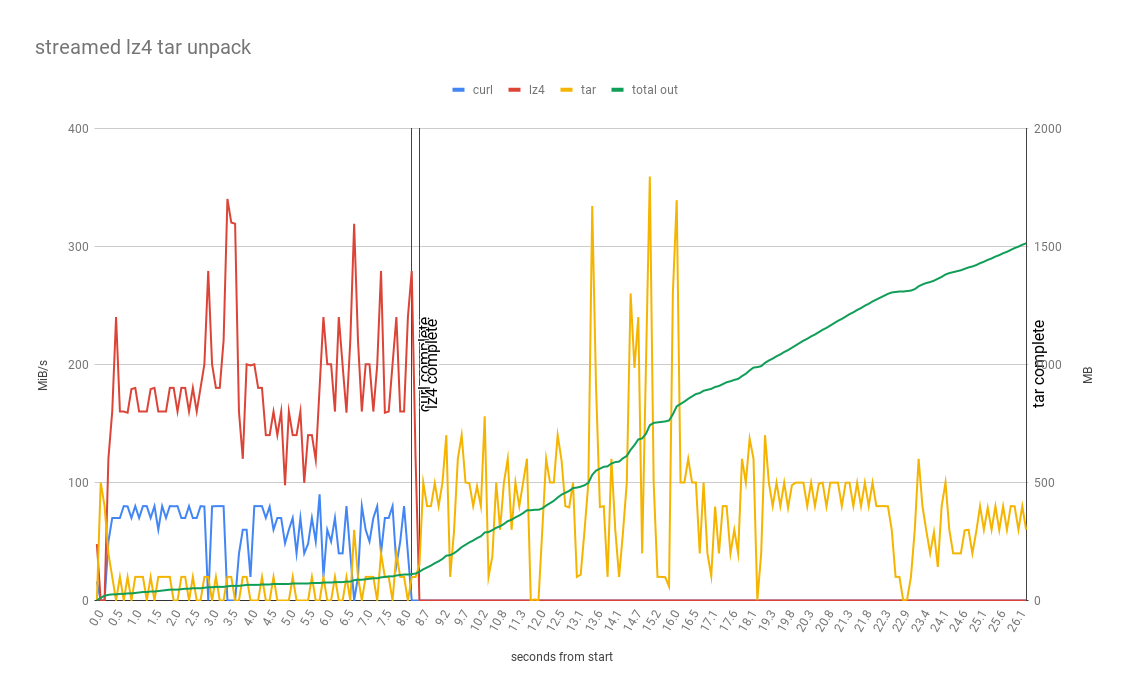
But collecting the data wasn’t as straight forward as I expected, and going through the exercise uncovered some surprising results. So I’ll capture the approach for Future Nick to make it easier to do it again next time the need arises (rather than be lazy and guess).
Capturing metrics on data flowing through a Unix pipe
Some of the scenarios being tested in Better CI Caching were a chain of commands piped together curl .. | lz4 .. | tar ... Obviously this is a great feature on Unix and processing the data as a stream is often a more efficient way to do it, but it makes the individual processes hard to measure. This is especially true when you consider that UNIX pipes naturally have back-pressure, they will only process as much as they can in coordination with their neighbours. So if a downstream command like tar is slower than an upstream command like lz4 (which it absolutely is) then lz4 will wait until tar is ready. This creates the scenario where lz4 run by itself will finish much quicker than if its run piped to tar, and that makes measuring how long each step takes difficult!
After some googling I come across mbuffer, it can solve this exact problem. It can measure data flowing through a pipe and it can eagerly buffer data to avoid back-pressure effecting the measurements of each command. It is similar to pv (pipeview) but with more of a focus on buffering and less on measuring progress, also I couldn’t get pv to work in this usecase, it wouldn’t buffer as I was expecting for some reason.
So instead of piped commands which have back-pressure, and aren’t measurable:
curl $LZ4_URL | lz4 -q -d - | tar -x -C $(mktemp -d)
Instead we buffer in-between each step to avoid back-pressure effecting accurate timing:
curl $LZ4_URL | mbuffer -m 1G | lz4 -q -d - | mbuffer -m 2G | tar -x -C $(mktemp -d)
which works.. buut both mbuffer processes dump stuff into stderr, and there is no timestamp to relate the datapoints together by. So to collect the data in a usable way (split each part of pipe, and timestamp) we need to tweak it like this (there might be a way to do this without using fifo files but I don’t know it):
# create 2 fifo files, one for each mbuffer process
mkfifo curl-target
mkfifo decomp-target

# read from fifo and timestamp before writing to file
cat < curl-target | ts '%H:%M:%.S' > curl-log &
cat < decomp-target | ts '%H:%M:%.S' > decomp-log &

# make the mbuffer reporting interval 100ms for more resolution
echo "StatusInterval=0.1" > ~/.mbuffer.rc

# as before, but with logging to our fifo file and verbosity at level 5 to get details of progress, redirect stderr so we don't spam the console.
curl $LZ4_URL | mbuffer -m 1G -v 5 -l curl-target 2> /dev/null | lz4 -q -d - | mbuffer -m 2G -v 5 -l decomp-target 2> /dev/null | tar -x -C $(mktemp -d)
When this process completes we will have detailed, timestamped data on the data flowing through the steps in the pipe, it can be hand munged or sed or similar to make it graphable, logs look like:
...
11:24:07.362232 mbuffer: in @  0.0 kiB/s, out @ 39.9 MiB/s,  568 MiB total, buffer  46% full
11:24:07.462307 mbuffer: in @  0.0 kiB/s, out @  120 MiB/s,  580 MiB total, buffer  46% full
11:24:07.562473 mbuffer: in @  0.0 kiB/s, out @ 59.9 MiB/s,  586 MiB total, buffer  45% full
11:24:07.780010 mbuffer: in @  0.0 kiB/s, out @ 20.0 MiB/s,  588 MiB total, buffer  45% full
11:24:07.880290 mbuffer: in @  0.0 kiB/s, out @ 45.9 MiB/s,  598 MiB total, buffer  45% full
11:24:07.980471 mbuffer: in @  0.0 kiB/s, out @ 99.8 MiB/s,  608 MiB total, buffer  44% full
11:24:08.080530 mbuffer: in @  0.0 kiB/s, out @  260 MiB/s,  634 MiB total, buffer  43% full
11:24:08.180689 mbuffer: in @  0.0 kiB/s, out @  240 MiB/s,  658 MiB total, buffer  42% full
11:24:08.280833 mbuffer: in @  0.0 kiB/s, out @  240 MiB/s,  682 MiB total, buffer  41% full
11:24:08.381002 mbuffer: in @  0.0 kiB/s, out @  0.0 kiB/s,  682 MiB total, buffer  41% full
11:24:08.481151 mbuffer: in @  0.0 kiB/s, out @  0.0 kiB/s,  682 MiB total, buffer  41% full
11:24:08.581283 mbuffer: in @  0.0 kiB/s, out @ 79.9 MiB/s,  690 MiB total, buffer  40% full
11:24:08.681431 mbuffer: in @  0.0 kiB/s, out @  300 MiB/s,  720 MiB total, buffer  39% full
11:24:08.781526 mbuffer: in @  0.0 kiB/s, out @  260 MiB/s,  746 MiB total, buffer  38% full
11:24:08.881673 mbuffer: in @  0.0 kiB/s, out @ 59.9 MiB/s,  752 MiB total, buffer  37% full
11:24:08.981813 mbuffer: in @  0.0 kiB/s, out @ 39.9 MiB/s,  756 MiB total, buffer  37% full
...
reformatted for graphing looks like:
timestamp,out mib, total mib, buffer pct
11:24:07.362232,39.9,568,46%
11:24:07.462307,120,580,46%
11:24:07.562473,59.9,586,45%
11:24:07.780010,20.0,588,45%
11:24:07.880290,45.9,598,45%
11:24:07.980471,99.8,608,44%
11:24:08.080530,260,634,43%
11:24:08.180689,240,658,42%
11:24:08.280833,240,682,41%
11:24:08.381002,0.0,682,41%
11:24:08.481151,0.0,682,41%
11:24:08.581283,79.9,690,40%
11:24:08.681431,300,720,39%
11:24:08.781526,260,746,38%
11:24:08.881673,59.9,752,37%
11:24:08.981813,39.9,756,37%
Capturing metrics of a file downloading (bit limited)
Other scenarios I was testing aren’t processes in a pipe, they are just a download to file, and then operating on the file. But because I got such nice 100ms interval measurements from mbuffer in the pipe I wanted the equivalent when not in the pipe. The problem was that I wanted to test curl and aria2 (and maybe others?) and they report progress differently and some don’t support piping outputs etc. So rather than messing with their logging and post-processing it into what I want, i’ll just measure the file being downloaded every 100ms, easy!
# or curl.. or anything that write one file effectively..
aria2c -d $WORKDIR -s 16 -x 16 -k 10M --file-allocation=none $SQUASHFS_URL &
pid=$!
while [ -e /proc/$pid ]; do
  du -sh $WORKDIR/node_modules.squashfs 2> /dev/null | ts '%H:%M:%.S' >> dl-log
  sleep 0.1
done
Works fine, but then I got stuck with unsquashfs and found a better way..
Capturing disk writes of an arbitrary process (more generalised)
So checking the size of file works ok for curl or similar, but what about an unpack like tar or unsquashfs or even unzip? There is no single file to measure, and we don’t want to be summing up all the files under a path, too expensive!. Luckily we can just check /proc for our pid, /proc/$pid/io to be exact. It looks like (as per):
# cat /proc/3828/io
rchar: 323934931
wchar: 323929600
syscr: 632687
syscw: 632675
read_bytes: 0
write_bytes: 323932160
cancelled_write_bytes: 0
So for a given PID we can cheaply get the number of bytes written at a given point in time, perfect! This gives us a more generalisable primitive to measure the behaviour of a process, don’t need to check file size at all, we can use /proc/../io for both cases.
# anything that we want to measure how fast it writes to disk..
unsquashfs -d node_modules $WORKDIR/node_modules.squashfs &
pid=$!
while [ -e /proc/$pid/io ]; do
	WRITE_BYTES=$(cat /proc/$pid/io | grep "^write_bytes" | cut -d ':' -f 2 | tr -d '[:space:]')
	echo ";;$WRITE_BYTES" | ts '%H:%M:%.S' | sed 's| ;|;|g' >> unsquash-log
	sleep 0.1
done
Outputs:
...
11:24:07.362232,1000
11:24:07.462307,2000
11:24:07.562473,3000
11:24:07.780010,4000
11:24:07.880290,5000
11:24:07.980471,6000
11:24:08.080530,7000
11:24:08.180689,8000
11:24:08.280833,9000
11:24:08.381002,10000
...
Which can be dropped straight into spreadsheet for a graph!